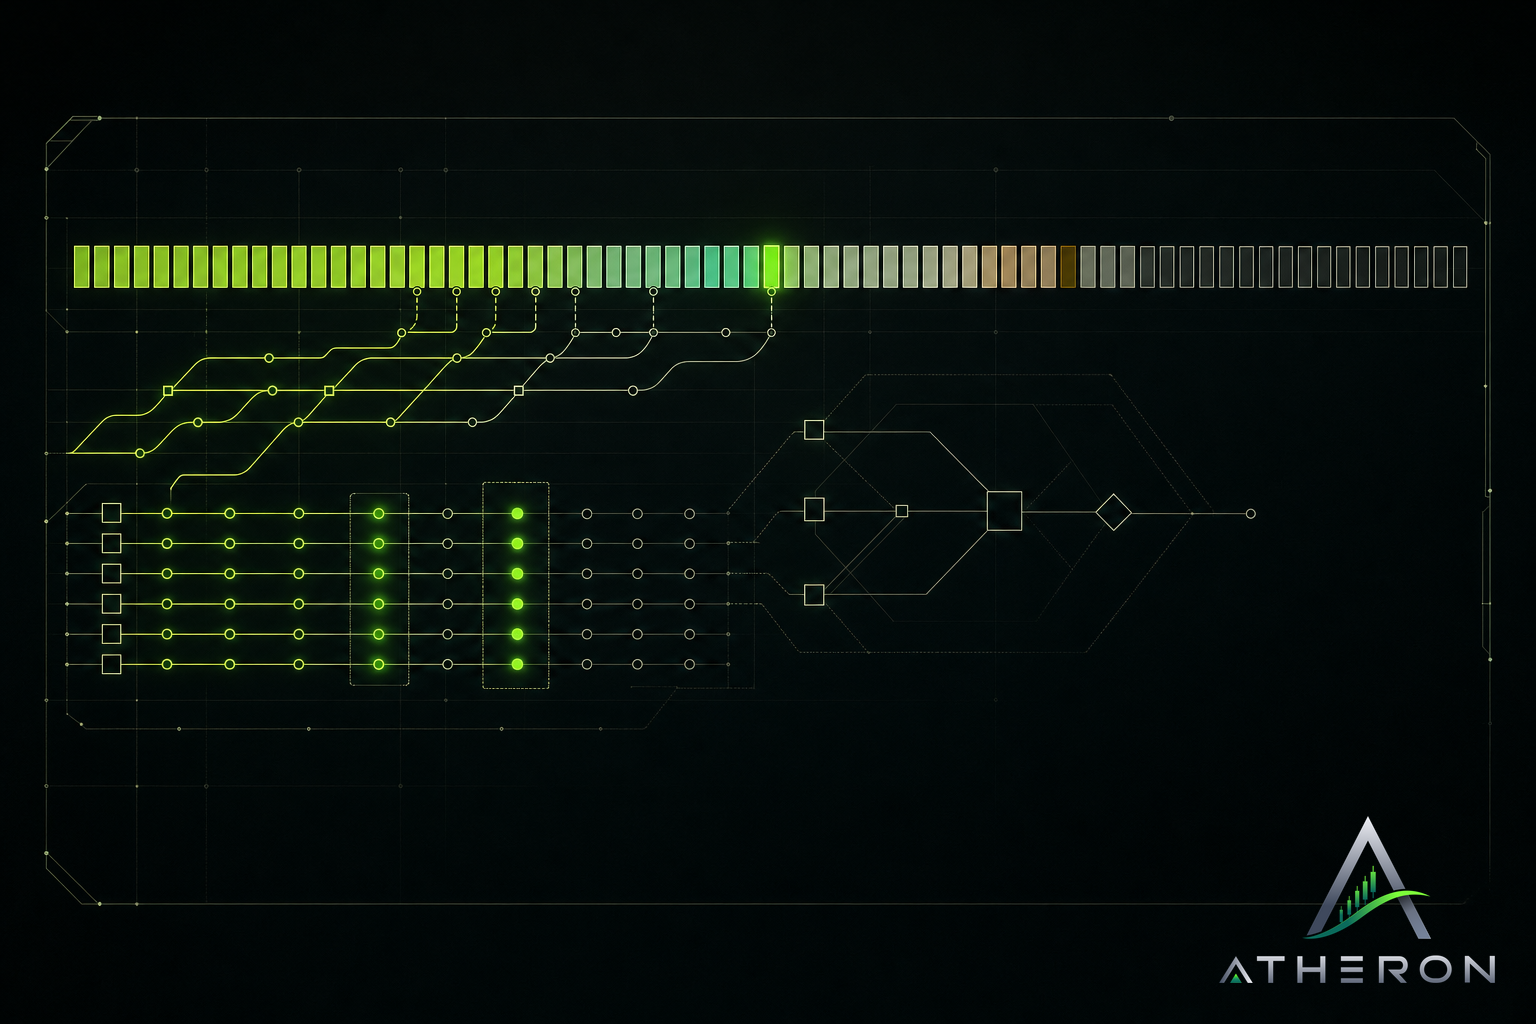
Our status page is short on words on purpose. Each public service gets a row of ninety days. Each day gets one colour. That colour is set by the worst event of that day.
This piece is about reading that row well. Not just spotting a bad day, but telling what kind of bad day it was, and what the full ninety days says about a service.
One colour, one day
A day can hold many things. A short slowdown in the morning. A planned maintenance window in the afternoon. A quiet evening. The page does not average those out. It shows the most serious event that happened.
That choice has a cost. A day with ten good hours and one poor hour looks like a poor day. We accept that. An average would hide the hour you might have been trying to use the service.
The legend on the status page tells you which colour stands for which kind of event. Use it rather than guessing.
Slowness is not downtime
A service can be up and still not be good to use. Pages load late. Requests take longer than they should. Nothing is broken, but you feel it.
We record that as slowness, and it gets its own mark. We do this for two reasons:
- If we only marked full outages, a slow week would look clean. You would trust the row more than you should.
- If we marked slowness as an outage, we would overstate the problem. You would read a service as broken when it was only slow.
So when you see a slowness day, read it as: it worked, but not as well as it should have.
Maintenance is planned, and still shown
Sometimes we take a service down or limit it on purpose, to change or repair something. That is maintenance.
We still put it on the row. A planned interruption is still an interruption for you, if you happened to need the service then. Hiding it would make the history look better than your experience of it.
Maintenance gets its own mark so you can tell it apart from something that went wrong. A row with a few maintenance days tells a different story from a row with a few outage days, even if both are interruptions.
Reading ninety days, not one
One day tells you about one day. The row tells you about the service.
When we look at a service ourselves, we ask a few plain questions:
- How many days are not clean at all?
- Are the bad days spread out, or bunched together?
- Are they mostly slowness, mostly maintenance, or real outages?
- Is the recent end of the row better or worse than the older end?
A bunch of bad days followed by a long clean run usually means something was fixed. Bad days scattered evenly across ninety days usually means something has not been fixed yet. Neither reading is certain, but both are more useful than looking at today alone.
What the row cannot tell you
We want to be plain about the limits.
The row covers public services only. It says nothing about work that has not shipped yet. For that, look at the modules on each project, marked shipped, building, next or later.
The row also does not explain why something happened. It shows that it happened and how serious it was. For what changed, the changelog is the record.
And ninety days is a window, not a full history. A service that had a hard time long ago and a clean recent run will look clean.
Why we show it this way
We built Atheron Progress so you do not have to take our word for anything. Percentages are counted from module marks, never typed. The status row follows the same rule. It shows the worst of each day, including the parts we planned and the parts that were only slow.
If a row looks worse than you expected, that is the page working. Check the status page for yourself and read the row the way you would want us to read it.