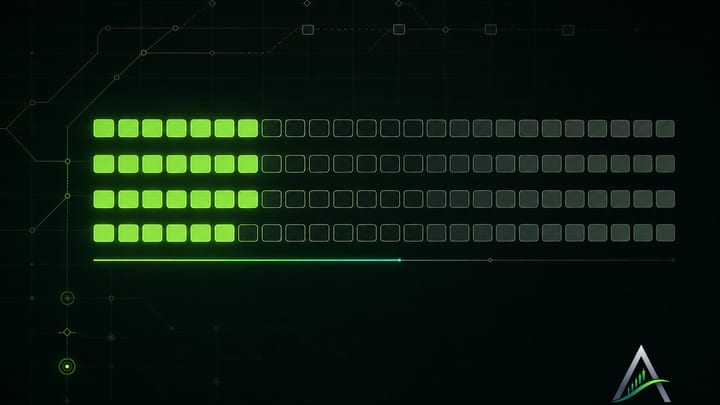
Most people look at a status page for one reason. Something feels wrong and you want to know if it is you or us. That is a fair use. But the status page on Atheron Progress holds more than today. Each public service shows ninety days of history, and the line as a whole tells you things a single day cannot.
This piece is about reading that line, not one square of it.
What one day can and cannot say
Every day on the strip carries one colour. That colour comes from the worst event of the day. If a service ran cleanly for twenty-three hours and was down for one, the day shows down. If it was slow in the morning and in planned maintenance in the evening, the day shows whichever of those counts as worse.
So a single day answers one question: what was the worst thing that happened here? It does not tell you how long it lasted, how many people noticed, or whether it happened once or five times. We chose this on purpose. A day that looks fine should mean the day was fine, all of it.
The cost of that choice is that one day alone can look worse than it felt. That is why the pattern matters.
Reading across the ninety days
When you look at the full strip, ask a few plain questions.
- How often does the colour change at all? A long run of clean days says the service is steady. Frequent marks say it is not, whatever the cause.
- Are the marks clustered or spread out? A cluster of bad days together usually points to one problem that took time to fix. Marks scattered across weeks suggest something that keeps coming back.
- Which kind of event is it? Maintenance, slowness and outages are different things. A strip with regular maintenance and nothing else reads very differently from one with repeated slowness.
- Is it getting better or worse? Compare the older end of the strip with the recent end. The direction often matters more than the count.
None of this needs a number. You can see it at a glance once you know what to look for.
Maintenance is not the same as trouble
Maintenance shows on the strip because it is real time when a service may not behave as usual. We would rather show it than hide it. But it is planned work, not a failure.
If you see maintenance at a steady rhythm, that is usually a sign of upkeep being done. If you see maintenance appear right after a run of slow or down days, that often means a fix going in. Read it in context, next to the days around it.
Slowness deserves attention
Slowness is easy to dismiss because the service is still up. We count it anyway. A service that answers late is not doing its job well, and you feel that even if nothing is technically broken.
On the strip, scattered slow days are worth noticing. They can be the early sign of a problem that has not yet become an outage. If you rely on a service, a rising number of slow days is the thing to watch.
Where to look next
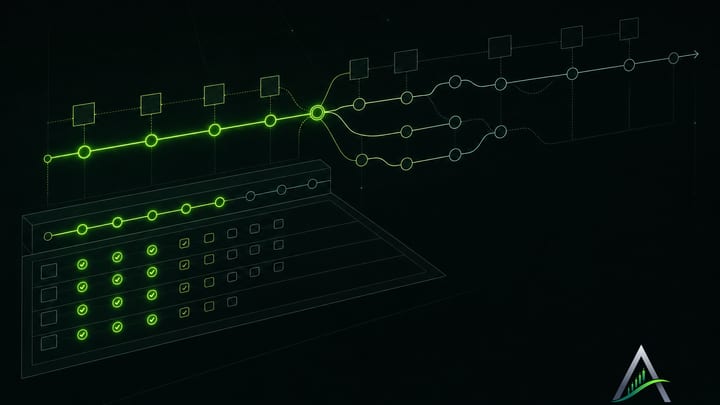
The status page and the progress tracker answer different questions. The status strip tells you whether a service was up and how well it ran. The project modules, marked shipped, building, next or later, tell you what exists and what is still coming.
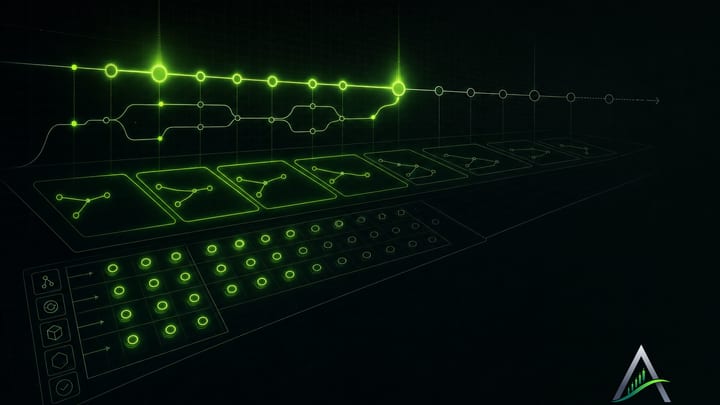
When a run of marks on the strip lines up with an entry in the changelog, you can often see both sides: the trouble, and the work that followed. That is the most honest picture we can give you, and it is all in public.
The short version
- One day shows the worst thing that happened that day, nothing more.
- Ninety days show the pattern: steady or not, clustered or spread, improving or slipping.
- Maintenance is planned work. Read it next to the days around it.
- Slowness counts, because you feel it.
- For what changed and why, read the changelog alongside the strip.
We show the whole line so you do not have to take our word for how things are going. You can read it yourself.